SNAP-CUTANA™ K-MetStat Panel
In stock
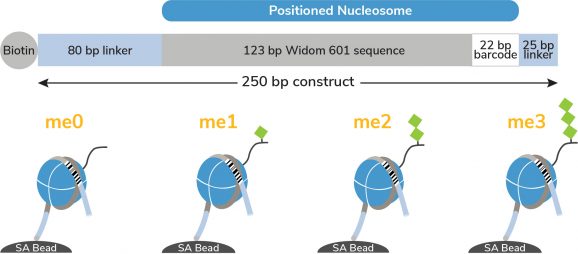
The SNAP-CUTANA K-MetStat Panel of spike-in controls for CUT&RUN and CUT&Tag offers an all-in-one solution to determine antibody specificity for histone post-translational modifications (PTMs), monitor assay success, and normalize data for quantitative chromatin mapping. The panel contains designer nucleosomes (dNucs) representing 16 different K-methyl PTM states: mono-, di-, and trimethylation at H3K4, H3K9, H3K27, H3K36, & H4K20, as well as unmodified control (Figure 1). Each PTM is represented by two unique DNA-barcoded templates (A and B, for an internal technical replicate). Each dNuc is individually conjugated to paramagnetic beads and pooled into a single panel for convenient one-step spike-in to CUT&RUN and CUT&Tag experiments. The panel is added to samples alongside ConA-immobilized cells prior to the addition of an antibody targeting a histone lysine methylation state or IgG negative control (see Application Notes and Table 1). pAG-MNase-mediated release or pAG-Tn5-mediated tagmentation of genomic chromatin and the barcoded nucleosomes is dependent on the specificity of the antibody used. After sequencing, the relative read count of each spike-in nucleosome barcode provides a quantitative metric of on- vs. off-target recovery (Figures 2 and 3) as well as quantitative sample normalization, thereby gauging experimental success, guiding troubleshooting efforts, and enabling reliable cross-sample comparisons.
Figure 1: Schematic of SNAP-CUTANA Spike-in Controls
The K-MetStat Panel controls for 15 widely studied methyl states (see Description) and an unmodified control (me0), with each of the 16 octamers wrapped with two uniquely barcoded DNA templates (A and B). Each 250 bp DNA template contains a 123 bp 601 nucleosome positioning sequence (gray) [Lowary & Widom, 1998], a unique 22 bp DNA-barcode (white; 32 barcodes total), and a 5’ biotin-TEG. The 5’ and 3’ linkers (blue) are compatible with cleavage by pAG-MNase (EpiCypher 14-1048, 15-1016) during CUT&RUN as well as tagmentation by pAG-Tn5 (EpiCypher 15-1017 ) during CUT&Tag. The dNucs are individually pre-conjugated to paramagnetic beads and pooled for convenient use.
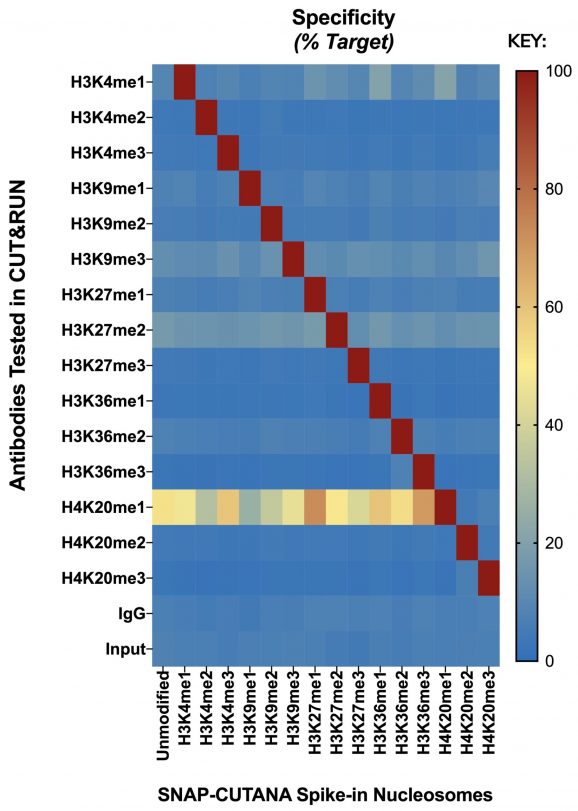
Figure 2: Panel Identity Profiling by CUT&RUN
CUT&RUN was performed on 500k fresh K-562 cells utilizing best in class identified antibodies to each PTM represented in the SNAP-CUTANA K-MetStat Panel. Prior to antibody addition, 2 µL of the control panel was spiked into each sample. CUT&RUN sequencing reads were aligned to the unique DNA barcodes in the panel and normalized to either on-target (anti-K-methyl PTM) or total counts (IgG, Input). Antibody enrichment of the expected spike-in nucleosome target (red) confirmed the identity and integrity of each member of the panel. CUT&RUN with IgG control antibody showed no preferential enrichment for any particular nucleosome (blue), as expected. Direct sequencing of the panel (Input) indicated balanced pooling of each nucleosome. While EpiCypher has not yet identified an H4K20me1 antibody with a preferred specificity profile in CUT&RUN, the clone shown has sufficient PTM preference to confirm the integrity of the barcoded nucleosome.
Note: While most antibodies used in these experiments show good target specificity in our standard CUT&RUN / CUT&Tag conditions, changes to antibody lots and experimental variables (cell number, cell type, experimental treatment, salt concentration, etc.) can have adverse effects on antibody specificity. Single-point antibody validation under optimal conditions is not a suitable substitute for controlled experiments with spike-ins. EpiCypher recommends using SNAP spike-in controls to monitor experimental success and accuracy in every possible reaction.
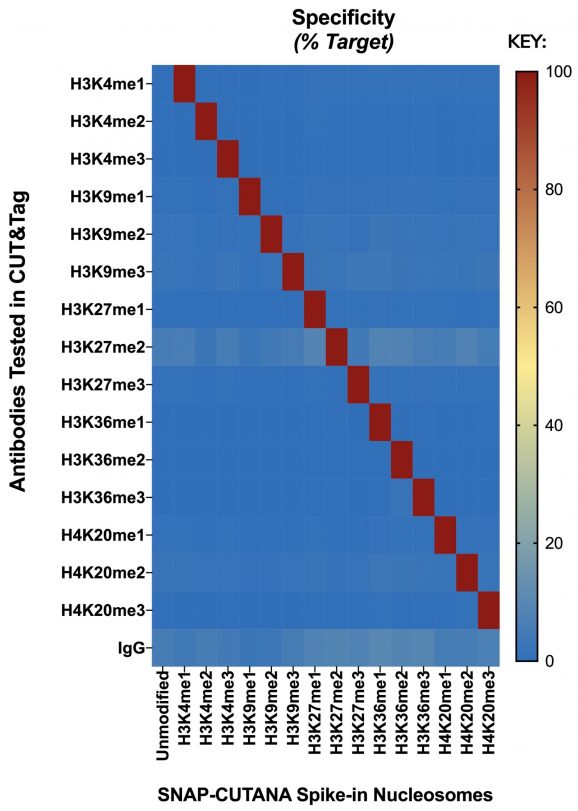
Figure 3: Panel Identity Profiling by CUT&Tag
CUT&Tag was performed on 100k fresh K-562 cells utilizing best in class identified antibodies to each PTM represented in the SNAP-CUTANA K-MetStat Panel. Prior to antibody addition, 2 µL of the control panel was spiked into each sample. CUT&Tag sequencing reads were aligned to the unique DNA barcodes in the panel and normalized to either on-target (anti-K-methyl PTM) or total counts (IgG). Antibody enrichment of the expected spike-in nucleosome target (red) confirmed the identity and integrity of each member of the panel. CUT&Tag with IgG control antibody showed no preferential enrichment for any particular nucleosome (blue), as expected.
Note: While most antibodies used in these experiments show good target specificity in our standard CUT&RUN / CUT&Tag conditions, changes to antibody lots and experimental variables (cell number, cell type, experimental treatment, salt concentration, etc.) can have adverse effects on antibody specificity. Single-point antibody validation under optimal conditions is not a suitable substitute for controlled experiments with spike-ins. EpiCypher recommends using SNAP spike-in controls to monitor experimental success and accuracy in every possible reaction.
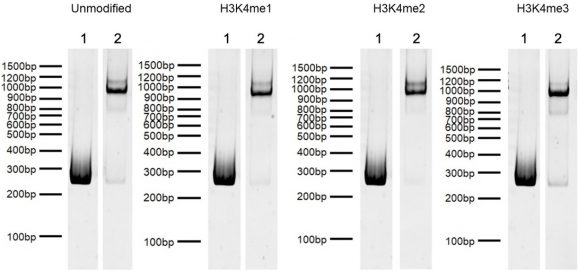
Figure 4: DNA Gel Data
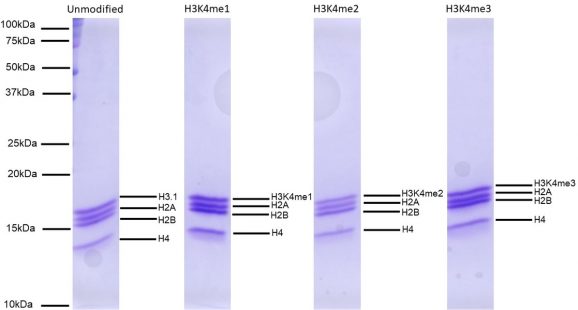
Figure 5: Protein Gel Data
Pipette to resuspend beads; DO NOT VORTEX
Formulation
A mixture of 16 PTM-defined semi-synthetic nucleosomes conjugated to paramagnetic beads in 10 mM sodium cacodylate pH 7.5, 100 mM NaCl, 1 mM EDTA, 50% glycerol (w/v), 1x Protease Inhibitor Cocktail, 100 μg/mL BSA, 10 mM β-mercaptoethanol. Molarity = 0.6 nM per nucleosome, 9.6 nM total nucleosome.
Application Notes
See the most recent EpiCypher CUT&RUN or CUT&Tag protocols for detailed information on workflow integration, expected results, data analysis, and troubleshooting. In Brief:
Product Use: Use the SNAP-CUTANA K-MetStat Panel for control reactions containing positive (e.g. H3K4me3) and negative (IgG) antibodies, as well as samples with an antibody to any of the 15 lysine methyl states in the K-MetStat Panel. Just before antibody addition, spike in 2 μL per 500k cells for CUT&RUN and 2 μL per 100k cells for CUT&Tag. If using less than the standard number of cells, decrease the amount of SNAP-CUTANA spike-in linearly by preparing a “working stock” dilution of the panel in the appropriate buffer, made fresh the day of use (Table 1). Adjust spike-in volume as needed; aiming for the spike-ins to comprise ~1% of the total sequencing reads. Expect higher for low abundance targets / negative controls (IgG; ~10-20%) and lower for high abundance targets (H3K27me3; 0.1-1%). Table 1 gives recommended dilution amounts for varying numbers of starting cells, but optimization may be required for user-specific conditions.
Data Analysis: Perform paired end sequencing for a minimum of 50 bases. The Widom 601 DNA and DNA barcodes are distinct from human, mouse, fly, and yeast genomes such that they can be readily distinguished from sample chromatin. A shell script (.sh file extension) for spike-in alignment and an excel template for heatmap generation are available in the Documents & Resources section below. The shell script can be opened with any basic text editor program and contains detailed instructions hashed (#) at the beginning of the document. Make sure to copy and paste the R1 & R2 echo loop so there is a set for each sample being analyzed.


