CUTANA® Cloud: CUT&RUN and CUT&Tag Bioinformatics Made Simple
CUTANA™ Cloud: CUT&RUN and CUT&Tag Bioinformatics Made Simple
Upload. Analyze. Discover.
CUTANA™ Cloud is a web platform that simplifies bioinformatic analysis of CUT&RUN and CUT&Tag data. Designed for speed, security, and ease-of-use, it rapidly aligns raw sequencing files to quickly determine the success of an experiment.
Analysis of epigenomic data can be a major bottleneck, delaying experimental validation and slowing the path to biological insights. CUTANA™ Cloud eliminates these challenges, providing an accessible solution for every researcher — no coding required.
- Results in as little as 90 minutes
- No coding required, intuitive interface
- Secure, enterprise-grade cloud infrastructure
- Automated workflows, built-in data visualization
- No Subscriptions, with pay-as-you-go pricing
Have Questions?
We’re here to help. Click below and a member of our team will get back to you shortly!
Plug right into the CUTANA™ Ecosystem
Try CUTANA™ Cloud: Explore Sample Data for FREE
*For Research Use Only. Available to U.S. customers only.
CUTANA™ Cloud: Built for Every Researcher
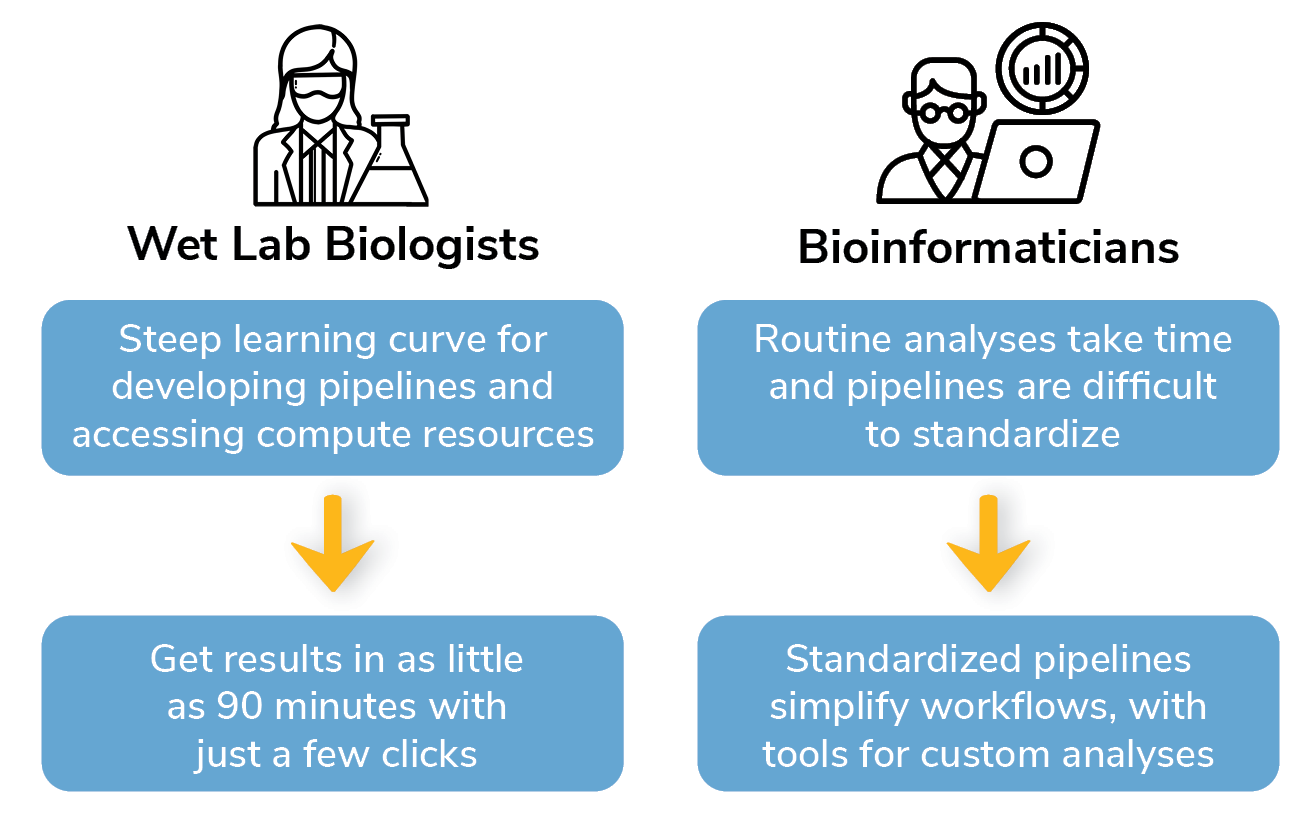
CUTANA™ Cloud solves many of the challenges faced by both bench biologists and data scientists.
CUTANA™ Cloud Walkthrough
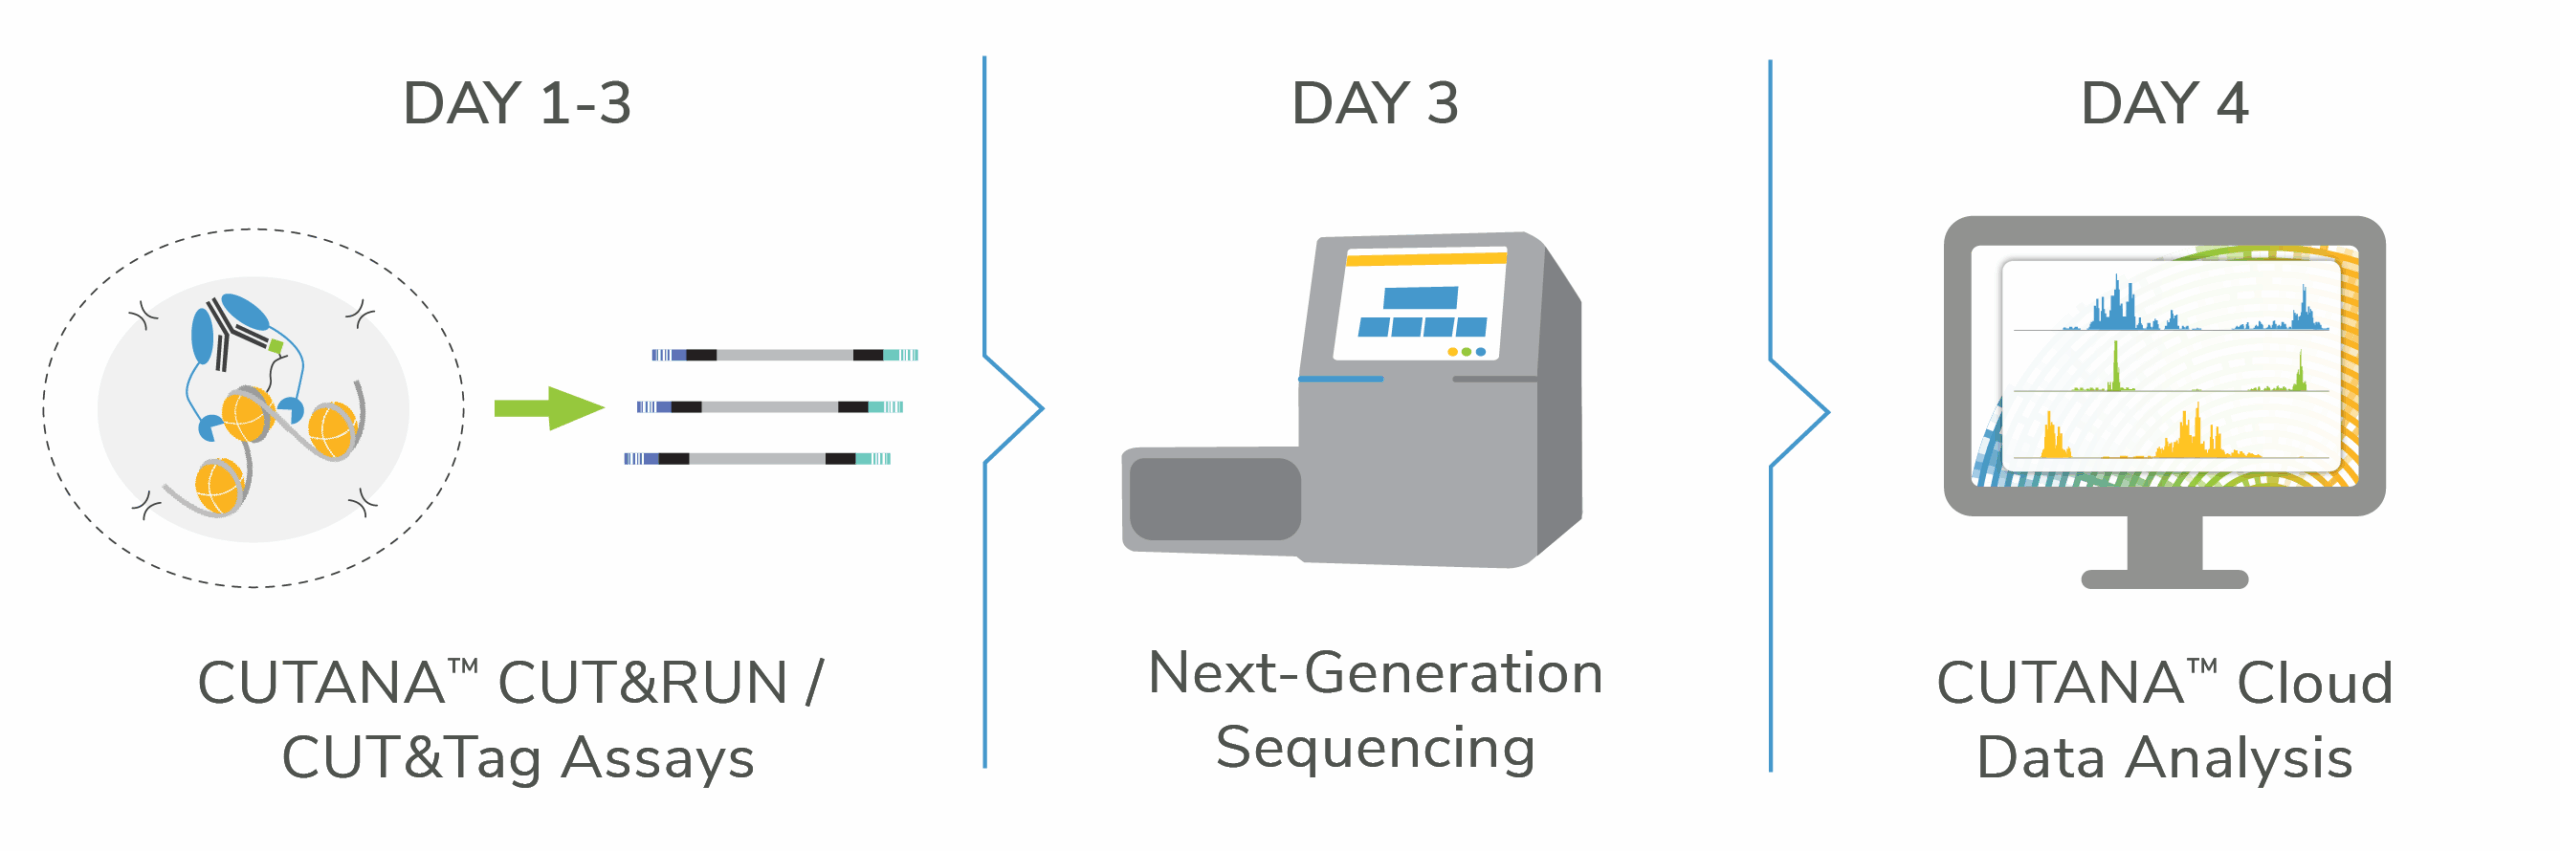
The Cloud Workflow: From Data Upload to Discovery
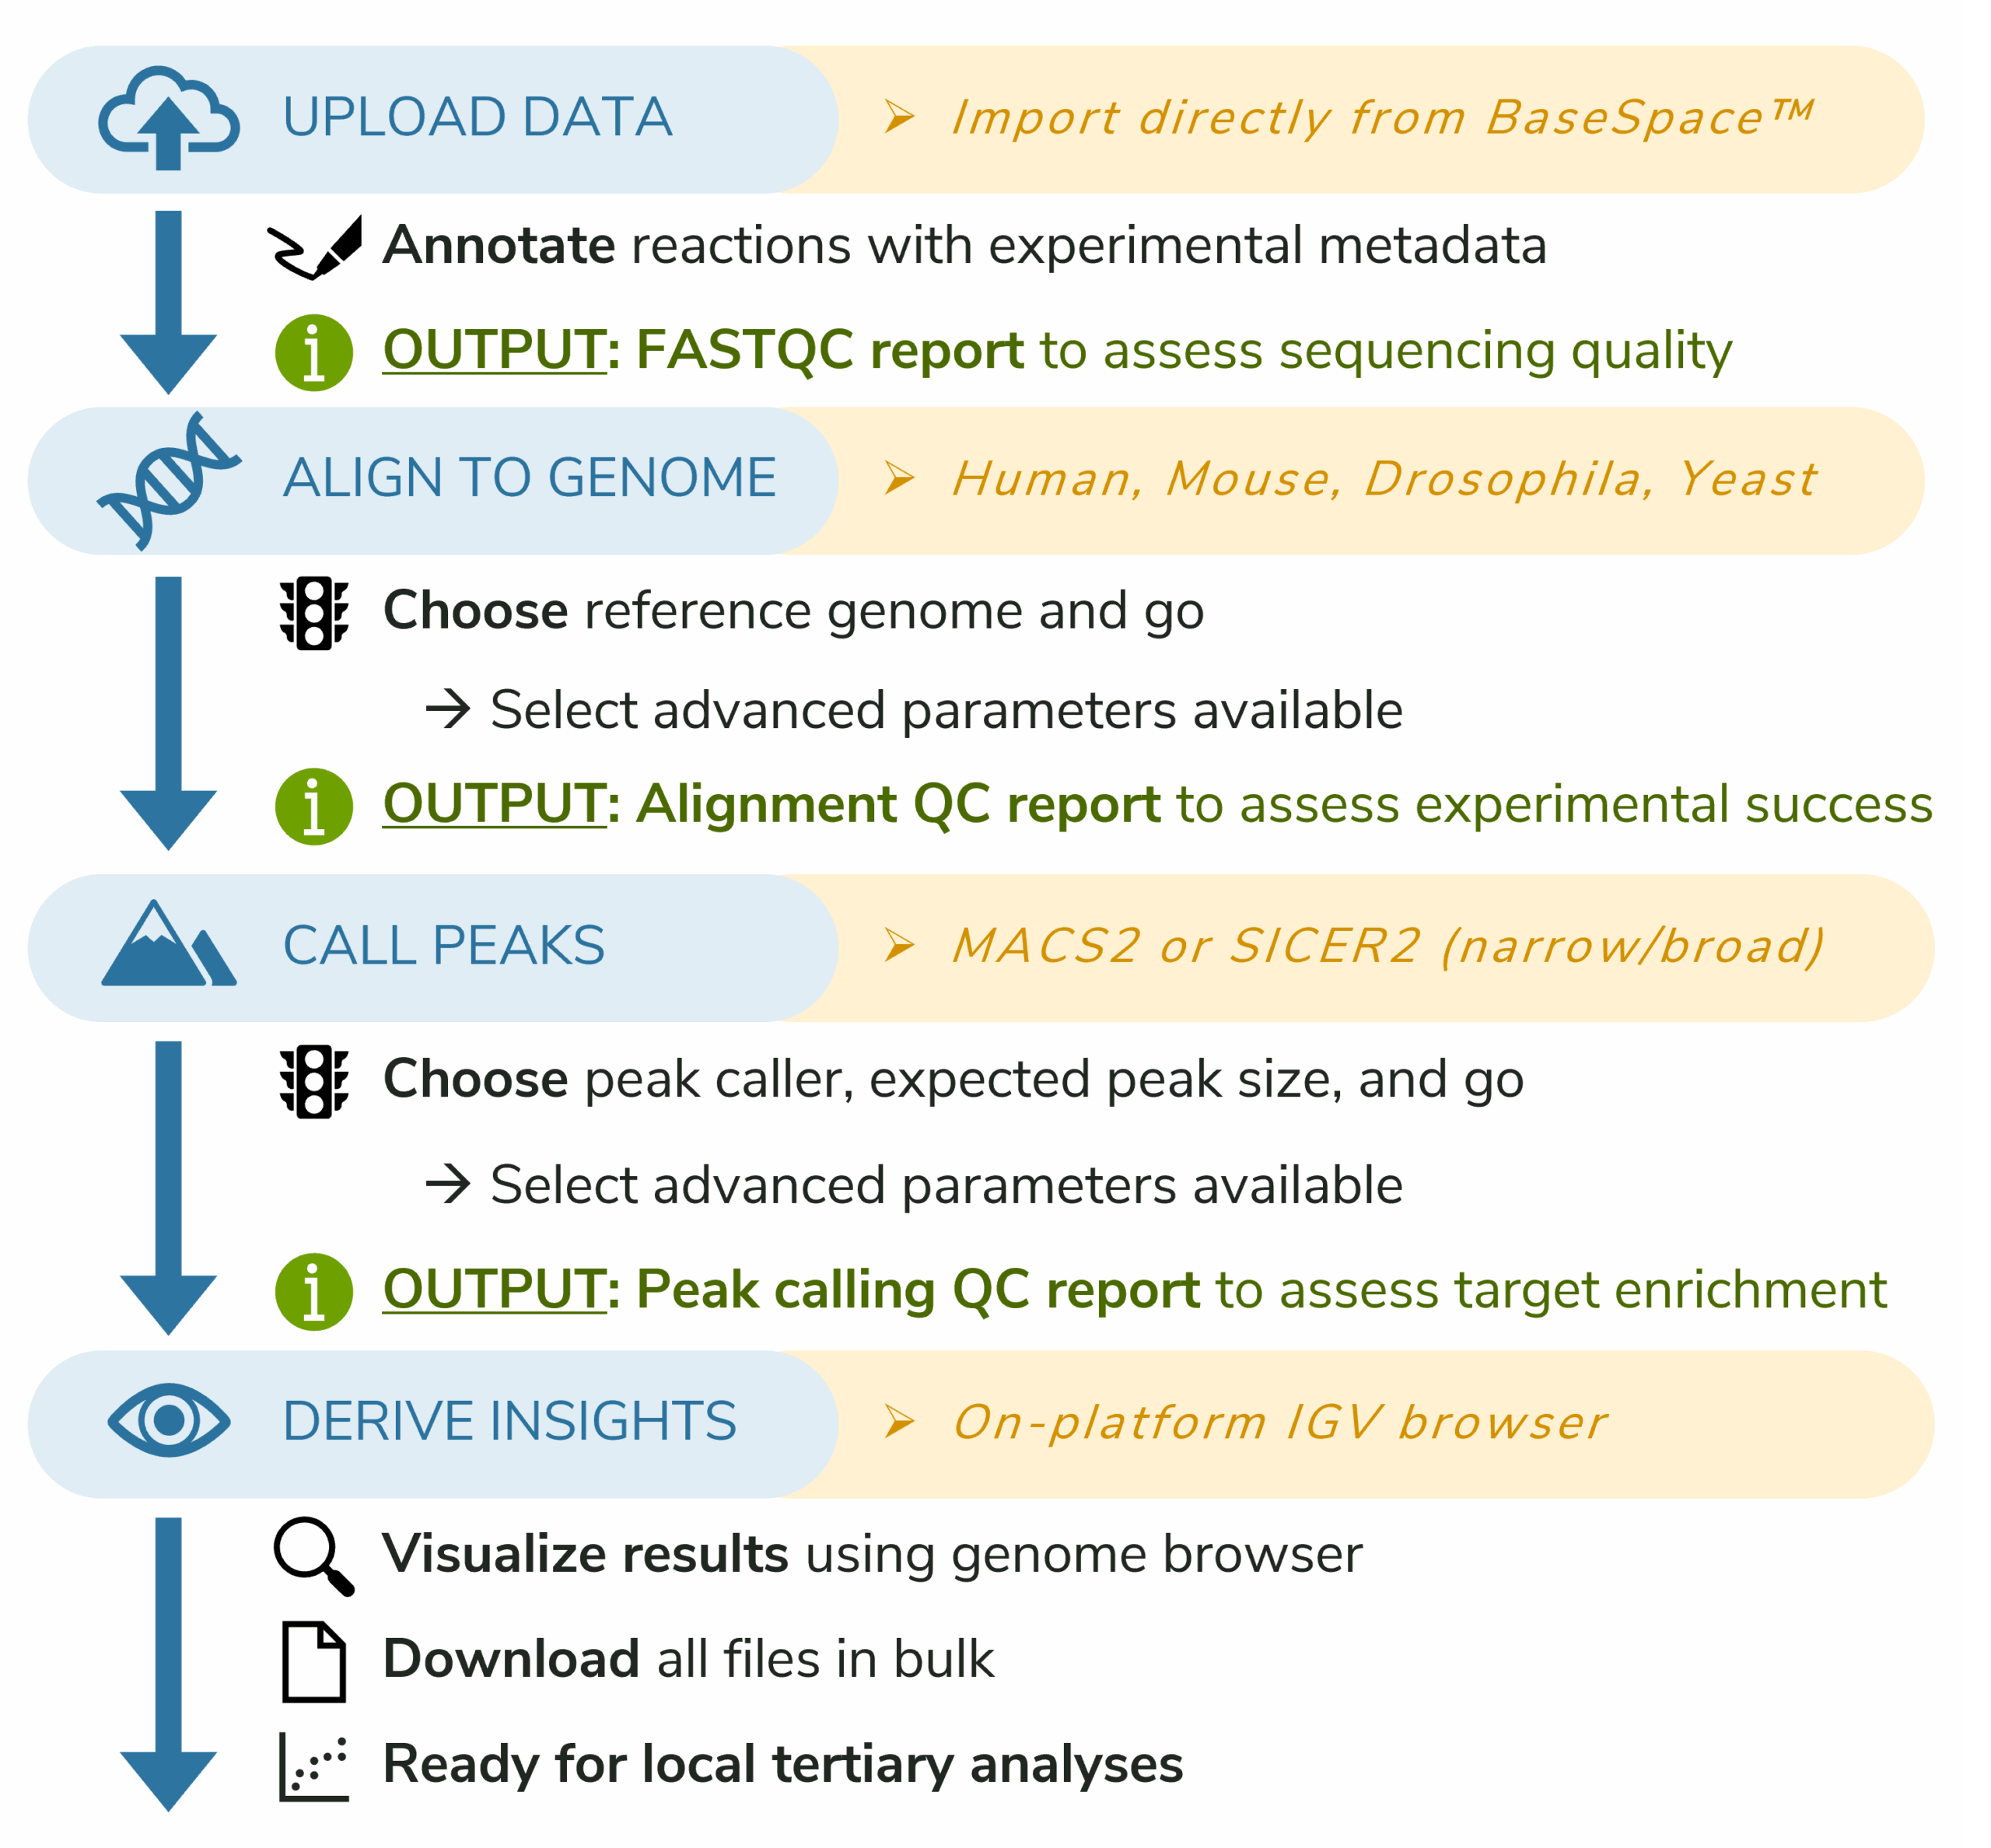
CUTANA™ Cloud guides you through four easy steps, all from your browser
- Choose from multiple options to upload raw FASTQ sequencing files. Save precious hard drive space by connecting directly to BaseSpace™ for seamless file transfers.
- Align sequencing reads to a reference genome, revealing where sequences are enriched across the genome. Customize parameters for your study and get an email notification when analysis completes.
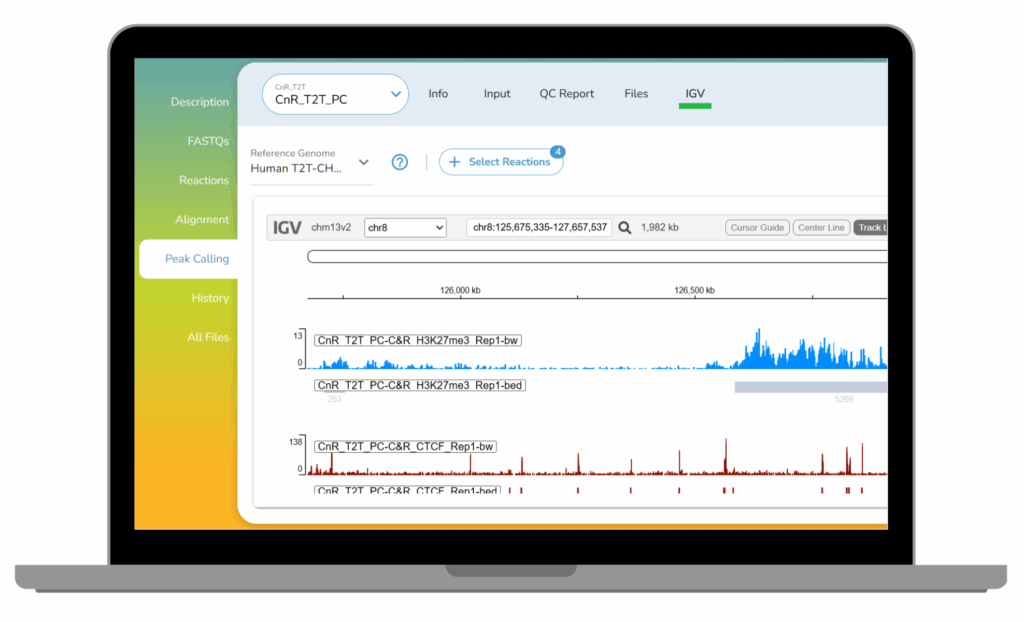
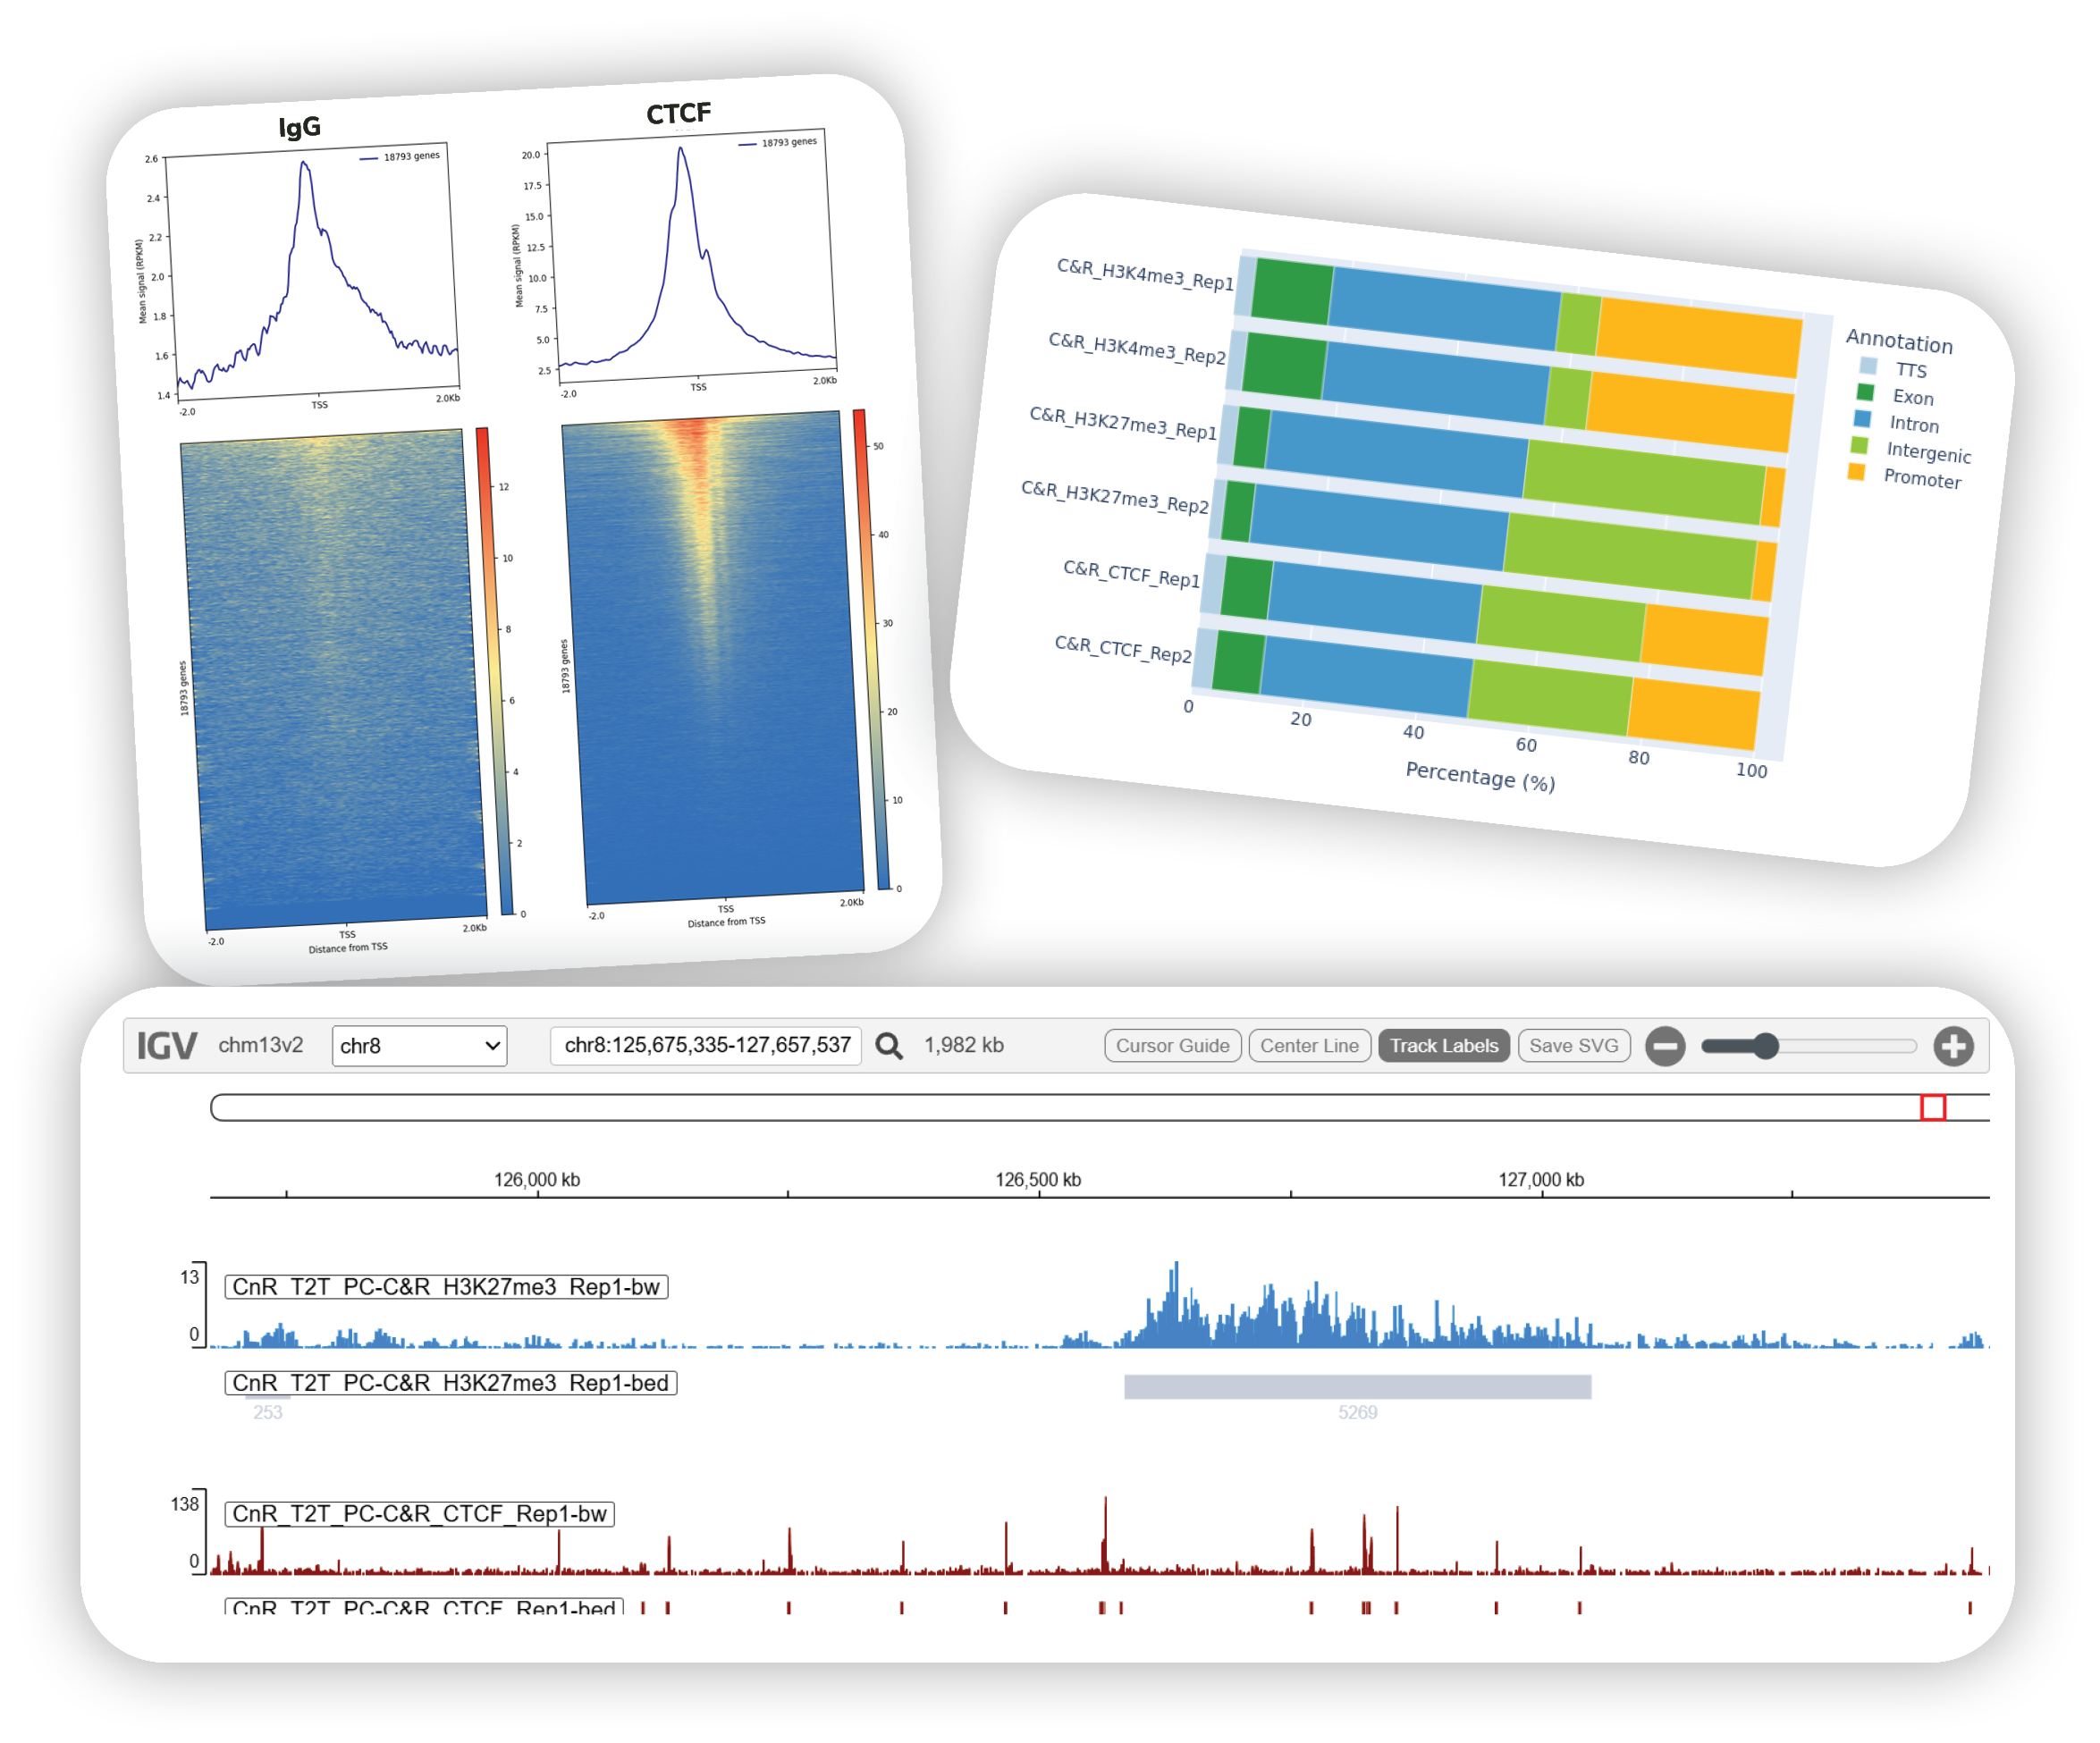
- Call peaks to pinpoint genomic regions where aligned reads are significantly enriched over background, defining protein or histone mark-containing domains. Review QC reports to asses key metrics such as Fraction of Reads in Peaks (FRiP), a standard measure of signal-to-noise. Explore peak distributions across genomic features (e.g., promoters, exons, intergenic regions) to place results in biological context and qualitatively compare replicate datasets.
- Visualize and export your results with ease. Inspect peaks directly in the platform using the built-in genome browser (IGV), and generate publication-ready methods reports and QC summaries. Download complete datasets, reports, and visualization files for downstream analysis or sharing with collaborators.
CUTANA™ Cloud Pricing
Data Analysis Credits
Each credit equates to one genome alignment of a CUT&RUN/CUT&Tag reaction sequenced up to 20 million total reads (0.25 credits extra per 20 million reads thereafter). Peak calling is free of charge.
CREDITS
| Introductory Price Per Credit | Standard Price Per Credit |
8 – 23 | $25* | $40 |
24 – 95 | $25* | $35 |
96 – 383 | $25* | $30 |
≥ 384 | N/A | $20 |
* Introductory price valid for any purchase through June 30th, 2026.
Data Storage
First 300GB FREE (~96 CUT&RUN/CUT&Tag reactions).
Thereafter, $350/year per TB.